 Announcing
New InspireData 1.5, The visual way to explore and understand data!
Inspiration Website | Visual Mapping Project | Visual Learning Project | InspireData
MirandaNet gratefully acknowledges the support it received in the past from Inspiration
InspireData™ builds critical data literacy skills and engages students. They actively explore and analyse data using dynamic Venn, bar, stack, pie and axis plots to interpret information and draw conclusions.
Some of the new powerful features in InspireData 1.5 include:
Easier Data Collection!
- e-Survey tool
Collect data anytime, anywhere using InspireData's e-Survey tool. Create and publish an online survey to gather data, then instantly download results to jumpstart analysis - 100+ subject-specific databases
Get started quickly with more than 100 content-rich databases. - Database
templates
Use database templates with predefined structure to guide data collection. - Expanded
data formatting options
Select and define field formats and valid list content to ensure consistent data collection.
- Bar Charts
Students can create a bar chart or a stack plot with one click. - Line of
best fit and line graphs
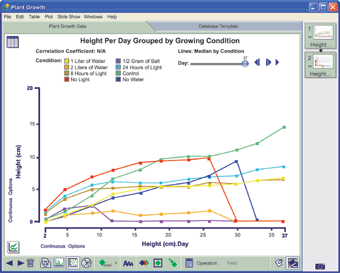
Display line of best fit and line graphs in axis plots to connect data points or to clarify data relationships and investigate trends. - Export plots
Export plots as .jpg, .gif or .png files.
Expanded Educator and Classroom Support!
- Lesson plans and classroom projects
These lesson plans include ideas and instructions for achieving key data literacy requirements, corresponding database templates to guide student data collection and exemplars for teacher demonstration and student assessment. - Learn-to-Use Handouts
These teacher tools provide easy-to-follow instructions for quickly learning and using InspireData. - Web resources
Teachers can easily access additional support materials such as lesson plans and database templates. - Teacher database templates
for classroom analysis
Customisable templates allow teachers to track student performance over time, identify classroom trends and support data-driven decision making.
[Back]


